Custom Live Plotting for SLiM
Russell Dinnage
Source:vignettes/articles/Custom_vis.Rmd
Custom_vis.RmdCustom Live Plots
This document describes how to make a custom visualization of SLiM
simulation results that can be used to monitor the output of simulation
while they are running. This takes advantage of the custom callbacks
feature of slim_run(). As an example we will implements a
genome visualization using ‘Hilbert curves’ to visualize the spatial
distribution of mutation in a simulation of genome evolution.
Hilbert Curves
Hilbert curves are one example of a “space-filling curve”.
Space-filling curves are a way of “folding” a one-dimensional sequence
into a two dimensional (or higher) space, in such a way that local
spatial structure is maintained (in other words, parts of the sequence
that are close together in one dimension also tend to be close together
in two dimensions). These are a handy way to visualize a linear sequence
(such as a genome) in a more space efficient way, taking advantage of
the two dimensions available to us in standard media. An R package for
plotting genomic data on Hilbert curves is available (the HilbertCurve
package from Bioconductor). We will use a Hilbert curve to visualize the
distribution on mutations in a simple genome evolution simulation. We
will start be writing our SLiM model using slimr syntax,
and using slimr_output() to output the mutations along our
simulated genome in our simulated population. This script is based on
recipe 6.1.14 from the SLiM manual. It sets up a simulation with three
effective “chromosomes” with low recombination within each chromosome.
This is the original SLiM script, which we then specify in
slimr:
initialize() {
  initializeMutationRate(1e-7);
  initializeMutationType("m1", 0.5, "f", 0.0);
  initializeMutationType("m2", 0.5, "f", 0.1);
  initializeGenomicElementType("g1", c(m1,m2), c(10000,1));
  initializeGenomicElement(g1, 0, 2999999);
  rates = c(1e-9, 0.5, 1e-9, 0.5, 1e-9);
  ends = c(999999, 1000000, 1999999, 2000000, 2999999);
  initializeRecombinationRate(rates, ends);
}

1 { sim.addSubpop("p1", 500); }

1:10000 late() { sim.outputFULL(); }
library(slimr, quietly = TRUE)
library(HilbertCurve, quietly = TRUE)
chromosome_sim <- slim_script(

  slim_block(initialize(), {
    initializeMutationRate( slimr_template("mut_rate", 1e-7) );
    initializeMutationType("m1", 0.5, "f", 0.0);
    initializeMutationType("m2", 0.5, "f", 0.1);
    initializeGenomicElementType("g1", c(m1, m2), c(10000, 1));
    initializeGenomicElement(g1, 0, 262142);
    rates = c(1e-9, 0.5, 1e-9, 0.5, 1e-9);
    ends = c(87381, 87382, 174762, 174763, 262143);
    initializeRecombinationRate(rates, ends);
  }),

  slim_block(1, {
    sim.addSubpop("p1", slimr_template("N", 500));
  }),

  slim_block(1, 1000, late(), {
    slimr_output( sim.outputFull() , "fix_mut", do_every = 5);
  })

)

chromosome_sim
## <slimr_script[3]>
## block_init:initialize() {
## initializeMutationRate(..mut_rate..);
## initializeMutationType("m1", 0.5, "f", 0);
## initializeMutationType("m2", 0.5, "f", 0.1);
## initializeGenomicElementType("g1", c(m1, m2), c(10000, 1));
## initializeGenomicElement(g1, 0, 262142);
## rates = c(1e-09, 0.5, 1e-09, 0.5, 1e-09);
## ends = c(87381, 87382, 174762, 174763, 262143);
## initializeRecombinationRate(rates, ends);
## }
##
## block_2:1 early() {
## sim.addSubpop("p1", ..N..);
## }
##
## block_3:1:1000 late() {
## {sim.outputFull() -> fix_mut}
## }
## This slimr_script has templating in block(s) block_init and
## block_2 for variables mut_rate and N.I’ve added a few slimr_template() calls to make it
easier to quickly change parameters in the script for exploration.
In order to make a custom visualization for this script we can
provide a custom callback function. This is a function which takes as
its first argument a dataset named data, which is
dynamically constructed while SLiM is running based on the
slimr_output() call in the script. To get an example
dataset we can use to test our callback function, we can just run the
script with capture_output = TRUE, which will capture the
data and output it in the final results. This will tell us what the data
will look like during the SLiM run. Since we just need it for testing
purposes, we can just run the simulation for a small number of
generations and on a small number of individuals (just enough to
accumulate a few mutations to test the visualization).
chromosome_sim_test <- slim_script_render(chromosome_sim,
                                           template = list(N = 100))
## Warning: Warning: A templated variable was not specified in the template and has been replaced by its default value.
output_test <- slim_run(chromosome_sim_test)##
##
## Simulation finished with exit status: 0
##
## Success!
output_test$output_data## # A tibble: 200 × 5
## generation name expression type data
## <int> <chr> <chr> <chr> <chr>
## 1 5 fix_mut sim.outputFull() slim_output "#OUT: 5 5 A\nVersion: 3\nPo…
## 2 10 fix_mut sim.outputFull() slim_output "#OUT: 10 10 A\nVersion: 3\n…
## 3 15 fix_mut sim.outputFull() slim_output "#OUT: 15 15 A\nVersion: 3\n…
## 4 20 fix_mut sim.outputFull() slim_output "#OUT: 20 20 A\nVersion: 3\n…
## 5 25 fix_mut sim.outputFull() slim_output "#OUT: 25 25 A\nVersion: 3\n…
## 6 30 fix_mut sim.outputFull() slim_output "#OUT: 30 30 A\nVersion: 3\n…
## 7 35 fix_mut sim.outputFull() slim_output "#OUT: 35 35 A\nVersion: 3\n…
## 8 40 fix_mut sim.outputFull() slim_output "#OUT: 40 40 A\nVersion: 3\n…
## 9 45 fix_mut sim.outputFull() slim_output "#OUT: 45 45 A\nVersion: 3\n…
## 10 50 fix_mut sim.outputFull() slim_output "#OUT: 50 50 A\nVersion: 3\n…
## # ℹ 190 more rowsSo now we can write a function that takes the outputted
tibble and make the desired plot. The first thing we need
to do is extract the relevant information from the full output. In this
case we only need the information on mutations: their position, and
their prevalance in the population. We can use the handy
slimr function
slim_extract_full(type = "mutation") for this. This
function extracts various pieces of the SLiM outputFull()
function, which contains all information about a population in a SLiM
simulation. In this case, we only need the information for the latest
generation. Let’s test it:
mut_dat <- slim_extract_full(output_test$output_data[nrow(output_test$output_data), ],
                                   "mutations")
mut_dat
## # A tibble: 74 × 11
## generation mut_id unique_mut_id mut_type chrome_pos selection dominance
## <int> <int> <int> <chr> <int> <dbl> <dbl>
## 1 1000 26 2224 m1 249993 0 0.5
## 2 1000 16 2227 m1 231334 0 0.5
## 3 1000 20 2329 m1 193444 0 0.5
## 4 1000 24 2393 m1 223502 0 0.5
## 5 1000 9 2577 m1 140559 0 0.5
## 6 1000 6 2634 m1 98828 0 0.5
## 7 1000 15 2694 m1 227379 0 0.5
## 8 1000 10 2804 m1 177402 0 0.5
## 9 1000 23 2825 m1 219505 0 0.5
## 10 1000 25 2862 m1 226389 0 0.5
## # ℹ 64 more rows
## # ℹ 4 more variables: subpop <chr>, first_gen <int>, prevalence <int>,
## # nucleotide <chr>Okay, so now we are ready to make our callback function. First we
will create a little function to plot the Hilbert Curve. This uses a
trick from the grDevices package to hold the display until
each plot is finished drawing. This gives the animation produced while
running the simulation a smoother appearance, but is not strictly
necessary.
## specify chromosome ranges for plotting
chrs <- IRanges::IRanges(start = c(0, 87382, 174763),
                         end = c(87382, 174763, 262143))

bg <- IRanges::IRanges(start = 0, end = 262143)

plot_HC <- function(positions, prevalence, chrs, bg, max_prev) {
  prevalence <- prevalence / max_prev
  cols <- colourvalues::color_values(c(0, prevalence, 1))[c(-1, -length(prevalence))]
  grDevices::dev.hold()
  hc = HilbertCurve(0, 262143, level = 4, reference = TRUE, arrow = FALSE)
  hc_polygon(hc, chrs)
  hc_points(hc, bg, np = 4, gp = gpar(fill = colourvalues::color_values(0)))
  hc_points(hc, x1 = positions, gp = gpar(fill = cols), np = 4, mean_mode = "weighted")
  invisible(grDevices::dev.flush())
}

#grDevices::dev.new(noRStudioGD = TRUE)
plot_HC(mut_dat$chrome_pos, mut_dat$prevalence, chrs, bg, max_prev = 200)
Now the final callback function:
make_hilbert <- function(data, max_prev) {
  mutation_data <- slim_extract_full(data[nrow(data), ], "mutations")
  plot_HC(mutation_data$chrome_pos, mutation_data$prevalence, chrs, bg, max_prev)
  invisible(NULL)
}
Let’s try it out!
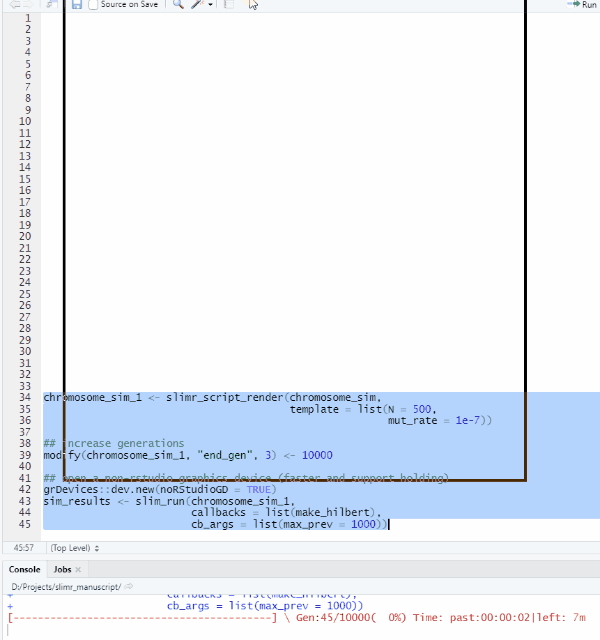
## change mutation rate and increase pop size
chromosome_sim_1 <- slim_script_render(chromosome_sim,
                                           template = list(N = 500,
                                                           mut_rate = 1e-6))

## increase generations
end_gen(chromosome_sim_1)[3] <- 10000

## open a non-rstudio graphics device (faster and support holding)
grDevices::dev.new(noRStudioGD = TRUE)
sim_results <- slim_run(chromosome_sim_1,
                        callbacks = list(make_hilbert),
                        cb_args = list(max_prev = 1000))